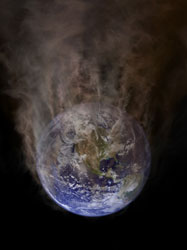
CO2, the mobile component of the carbon cycle
Although instruments have not been to date specifically designed to monitor carbon dioxide concentrations, high resolution infrared sounders have been flown aboard the National Oceanic and Atmospheric Administration (NOAA) meteorological satellites. In addition to their main mission of measuring atmospheric temperature and moisture global fields, atmospheric concentration variations of major greenhouse gases can be retrieved from these satellites' observations. The carbon dioxide (CO2) signatures, which essentially come from the middle to high troposphere, are weak and not easily interpreted in terms of global fields of CO2 concentrations. The method developed by the COCO project partners at the Centre National de la Recherche Scientifique has proven its ability to retrieve important features of the distribution of CO2 and its time evolution. Not only has the phase of the seasonal variations, but also their amplitude and latitudinal evolution matched in situ observations made by properly equipped commercial airliners. Moreover, the annual trend inferred corresponded to the known increase in the concentration of CO2 as a result of human activities. To detect changes that have occurred and importantly, to predict changes that can be expected in the future, observations from the NOAA TIROS-N Operational Vertical Sounder (TOVS) were used. The measured TOVS radiances were simulated with accurate forward radiative calculations and fixed specification for trace gases. An analysis of the differences between the measured and simulated TOVS brightness temperatures clearly revealed the signatures of multiyear and seasonal variations of CO2. To address its dependence upon the collocation between satellite observations and radiosonde measurements, and the uneven distribution of radiosonde stations, a nonlinear regression inverse model was further developed. Relying on observations from the only satellite, with the nonlinear regression inference scheme based on a Multilayer Perceptron (MLP) neural network monthly mean global maps of CO2 concentrations were produced. The coming analysis of the near 25 years archive accumulated by the NOAA meteorological satellites should contribute to a better understanding of the carbon cycle.


